
CMAC SCORES RECORD LOW IN MAY 2020 CRASH INDICATOR BASIC
- CMAC Communications

- Jun 10, 2020
- 2 min read
FMCSA defines Crash Indicator BASIC as “histories or patterns of high crash involvement such as frequency or severity”. These scores are only able to be seen by the carrier and enforcement officers. The Crash Indicator scoring doesn’t factor in accountability and is not specific to behavior, but to the consequences. It includes all accidents where police reports were made and all accidents where the other person was at fault
Higher percentile rankings indicate lower safety compliance.
In May 2020, CMAC’s Crash Indicator BASIC reached 21% - the lowest score we’ve received since 2014. It has been long, hard work to get below the 65% threshold, and our safety team, operations team, and drivers have gone above and beyond to ensure scores continue to trend downward.

In 2020 YTD, our Crash Indicator Scores are 51% less on average and decreasing at a rate of 70% per month since January. The CSA Scores for January through May 2020 were 59 times better than they were in 2018.

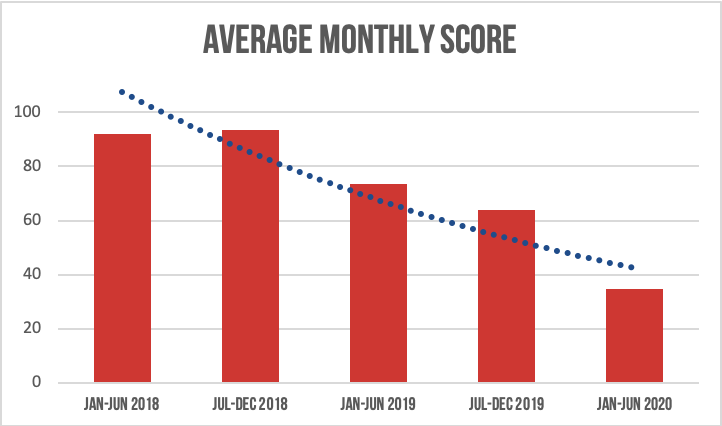
If you compare the last 12 month period (July 2019 - June 2020) with the same period from 2018-2019, CMAC’s average monthly score has decreased by 34.3 points or 41%.
From 2018 to 2020, the average monthly Crash Indicator BASIC was 24 points better than the year before. The average score YTD for 2020 is 55% less than the average score for 2019.
What We Did to Lower Our Scores:
Implemented training and communication program - reminding al drivers of speed and space management, construction awareness, focusing on foul weather driving
Qualcomm messages on any impending rain or snowstorm
Fleet managers help by reminding drivers to slow down during inclement weather
The Federal Motor Carrier Safety Administration (FMCSA) uses seven BASIC categories to determine how a motor carrier ranks relative to other carriers with a similar number of safety events (inspections, violations, crashes). Good CSA scores result in lower annual insurance premiums, customer preference, fewer DOT roadside audits or inspections, and easier driver recruitment based on reputation.
7 BASIC PERCENTILES
Unsafe Driving
Crash Indicator
Hours of Service (HOS) Compliance
Vehicle Maintenance
Controlled Substances/ Alcohol
Hazardous Materials Compliance
Driver Fitness
The seven categories are scored as BASIC percentiles. BASIC stands for Behavior Analysis and Safety Improvement Categories. When a fleet has enough safety data in BASIC, you’re given a BASIC percentile ranking from 0-100 based on your fleet’s violation rate. Percent-tiles rank your fleet based on others similar to yours and are used to decide if you’re fleet has trouble with safety performance. If one of your BASIC percentiles reaches a predefined threshold FMCSA will send a warning letter and/ or investigate. The 7 BASICS consist of 900+ violations.
Comments